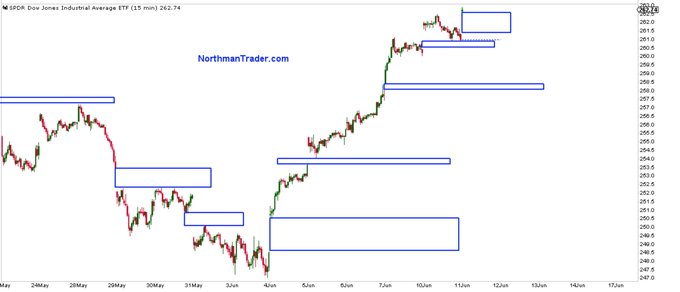
In technical analysis one always searches for actionable patterns. The biggest mistake people make when applying TA is they see potential patterns and treat them like they’re valid. Now mind you there’s no problem with seeing a potential pattern and aiming to position for it as long as you know exactly when the patterns is valid and confirmed. Patterns and signals can become INVALIDATED if they are not confirmed. This is where people often either jump the gun or keep hanging on to a pattern that’s no longer valid.
One must know when a pattern/signal is no longer valid and when to no longer act on it.
The reason I mention all this is because something interesting happened in the past couple of days.
Yesterday’s action in the $SPX, and many other index charts, produced what is known as a shooting star, a candle that can form on a gap up with price racing to new highs following an up trend and then reverses by end of day and leaves a long candle on the close.
We clearly saw this yesterday:
A classic definition of a shooting star: “The shooting star is made up of one candlestick (white or black) with a small body, long upper shadow, and small or nonexistent lower shadow. The size of the upper shadow should be at least twice the length of the body and the high/low range should be relatively large”.
Shooting stars often signal a bearish reversal imminent.
Lo and behold we had a big gap up today and markets screamed higher to new highs in vertical fashion and we could see folks chasing price into the upper daily Bollinger bands, which prompted me to tweet this tongue in cheek warning:
And also this gap warning:
While the shooting star was at risk of being invalidated with the gap up and new highs there were a number of other indicators that suggested this price advance was not sustainable.
$SPX subsequently reversed red and made new lows compared to yesterday.
This produced a candle known as a bearish engulfing candle. A classic definition: “The bearish engulfing pattern consists of two candlesticks: the first is white and the second black. The size of the white candlestick is relatively unimportant, but it should not be a doji, which would be relatively easy to engulf. The second should be a long black candlestick. The bigger it is, the more bearish the reversal. The black body must totally engulf the body of the first white candlestick”
This is kind of your classic bearish engulfing candle pattern:
And this is what we ended up getting today:
What’s frankly odd here is to see two distinct bearish candles back to back, a shooting star and then a bearish engulfing candle. I don’t recall ever seeing this specific combination. Maybe some other technicians can chime in here.
The technicals are trying to tell us something, BUT these types of candlesticks are not yet a confirmation!
Further weakness is required for bearish confirmation of this reversal pattern, i.e. a down day tomorrow, and, if it confirms, then, technically speaking, we can expect a lot more downside in the price action in the days ahead. But keep in mind, this market is very headline driven as we saw again last night. We’ll know more tomorrow.
For the latest public analysis please visit NorthmanTrader. To subscribe to our market products please visit Services.


