As soon as I heard that Friday’s nonfarm payrolls report was the biggest “miss” in history, I knew that something was “amiss.”
And it wasn’t the eConomissts estimates.
As much as I can’t stand Wall Street and most academic eConomissts, their jobs estimates are usually pretty good, rarely missing the BLS number by more than a few tenths or hundredths of a percent. This time, the difference was orders of magnitude.
I knew from this that the eConomissts had it right and the BLS had it wrong. Very, very wrong.
Could it be-ee-ee-ee, that the BLS, aka the Bureau of Liar Statistics wanted it that way? After all, a weak jobs number would be a good reason for a bond market rally. God knows the US Treasury and the Fed desperately want that, so as to give their Primary Dealer pals the appearance of still being among the living.
Or was it just another massive error in their seasonal fudge factor reporting. As I’ve watched this data closely every month, one thing I noticed that after 2 monthly revisions and 5 annual benchmark revisions, the final number for the month usually looks pretty much like the central tendency of eConomissts’ estimates for the first report. The eCons get it right, the BLS gets it wrong more often than not.
This time they got it very very wrong. Let’s dig into the numbers, just a bit. Does this look like a weak jobs report? We have 81 years of history on this. The first chart is the whole megillah. Then we zoom in to the last 5 years.


This is the actual data without the completely made up, seasonal fudge factor derived from a statistical trick formula called X-13 ARIMA. That essentially compares the current number to a 10 year average for the month. Just one thing is a little weird about that. The 10 years includes the last 5 years, and the next 5 years. Huh? Wait. What?
That’s right. It includes data that doesn’t exist yet. They project that too, and then they revise it based on the actual unemployment tax and withholding tax data every year until they have the final figure for this month 5 years from now. Got that?
Me neither.
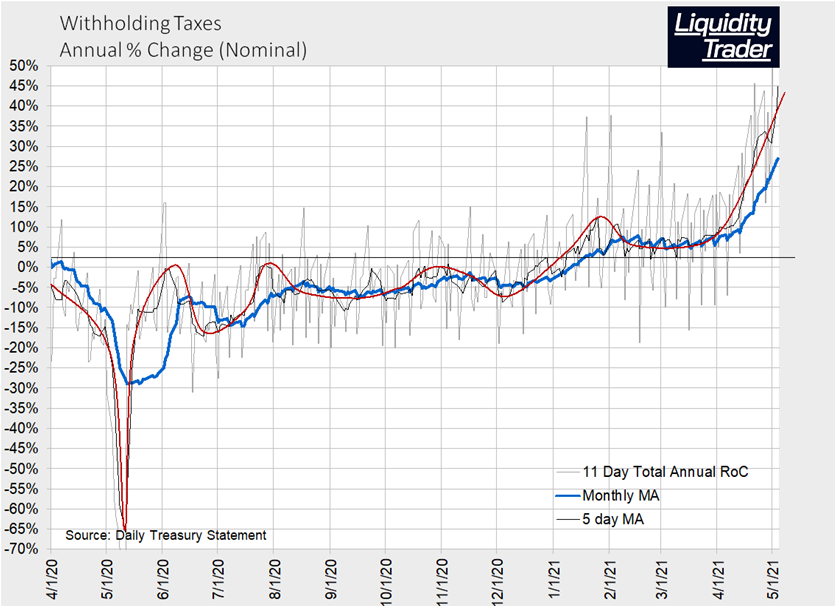
So what do we see in the actual data? Only the biggest year to year increase in history by orders of magnitude. Over 14 million jobs added since April 2020. And that is somehow a disappointment according to the BLS headline data. Just eyeballing the withholding taxes through month end April, and the actual, unfudged jobs survey, it seems patently obvious to me that the eConomissts’ guesses were a lot closer to reality than the BLS BS.
Look at the actual BLS not seasonally manipulated data

Fact. April had the largest month to month increase since April 2016. That was on top of a record increase in March.
Fact. This was the largest 3 month increase of the past 5 years. Not only that. It was the largest 3 month increase in HISTORY. By far.
Fact. This was the largest year to year increase in history, by far.
Fact. The survey date was April 12. The withholding tax data through early May showed that the trend was not only maintained, it accelerated. The increase was slower early in the month than post April 12.
Conclusion: There is no basis whatsoever for concluding that the jobs rebound is slowing. There’s no basis for concluding that the bond market “should” rally. There’s no basis for concluding that the stock market rally should pull back.
This stuff is red hot. Is there a basis then to conclude that the Fed will taper? Absolutely not. It can’t, and I tell you why, and the strategy and tactical ideas to take advantage of what’s ahead, here. Click to get a 90 day risk free trial. .