First they think you’re crazy and then they’ll join you.
On January 14th I outlined a rather obvious appearing correlation between the Fed’s repo operations and the market’s behavior: Every day, no matter what happens or what data is thrown at this market the same pattern repeats: Markets are jammed higher following the Fed’s repo operations.
It is this chart I’ve been posting on twitter every day since and no change to the pattern:
This has been going on for a while and has gone into overdrive since early December, the last real dip in markets: “Since the beginning of December, the combined reserve management purchases plus repo injections has been approximately $400 bn“.
The impact on the market’s behavior is now obvious in the charts, nothing but 45 degree channel price levitation:
And while folks like myself are being dismissed as QE conspiracy theorists the Wall Street Journal has now highlighted the same conclusion:
Derby’s Take: Idea That Fed Repos Are Driving Markets Gains Traction https://on.wsj.com/30OifgI
Derby’s Take: Idea That Fed Repos Are Driving Markets Gains Traction
Dallas Fed leader Robert Kaplan last week put a crack in Federal Reserve officials’ position that the central bank’s recent balance-sheet growth is a technical move and not a form of stimulus.
wsj.com
First they think you’re crazy and then they’ll join you.
The result of all this: Individual stocks have gone vertical and even index charts have joined what can be termed an 80’s party. RSIs in the 80s. RSI’s in the 70’s can be considered overbought. RSIs in the 80s can be considered exuberant chasing, permanent RSIs in the 80’s can be considered what? Dare I say a bubble as market caps are relentlessly exploding to the upside not remotely to be matched by upcoming earnings.
Just documenting history here, but here’s some charts that highlight the point.
$NDX futures chart, weekly RSI above 82, same level as during the January 2018 top:
Daily $XLK technology index, now seemingly permanently jammed in the 80s:
Check some of the individual stocks:
$GOOGL daily RSI at 80.74:
All this artificial liquidity causing reckless vertical price action in stocks?
$TSLA weekly RSI 86+:
$SPCE:
These are mere examples but stye highlight broader market action.
What’s next? RSIs in the 90’s? You don’t have to wait for this. They’re already here:
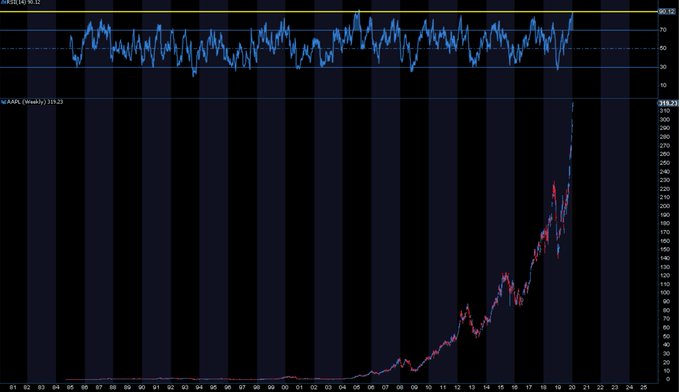
90 weekly RSI on $AAPL, a $1.4 trillion market cap company.
And yes I couldn’t resist to give the linear version just to highlight how vertical and one way the actions has been:
WARNING: I’m committing a chart crime and I don’t care.
Just to say: This is stupid.
This is the Fed’s doing, full stop.
I’ve been warning about this and may sound like I’m repeating myself, but I don’t care, this issue is too important not to highlight as many times as it takes.
What’s unfolding here is a perversion of financial markets.
The Fed in their arrogance and cluelessness didn’t realize this would happen, but it is and they are now directly responsible for fueling this massive bubble.
It’s reckless, it’s irresponsible, and the pressure on them is building.
And what are all these interventions producing?
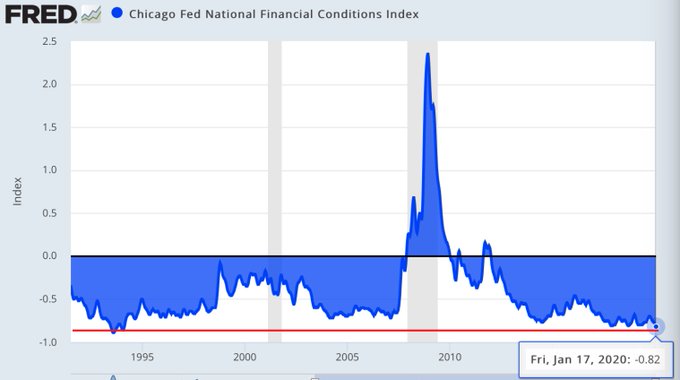
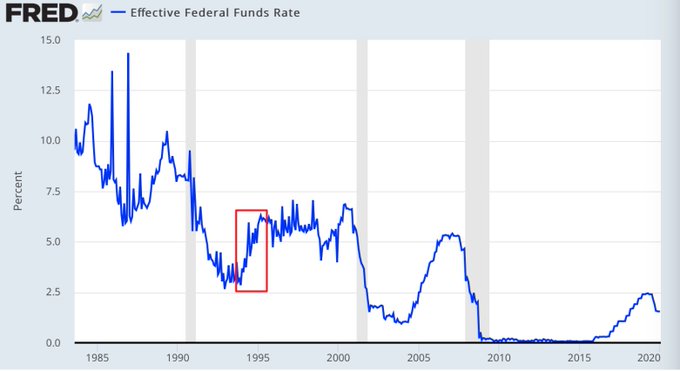
Last time financial conditions were this loose the Fed was RAISING rates.
I repeat: The Fed is totally reckless blowing an asset bubble.
Financial conditions do not warrant such crisis level interventions.
The loosest financial conditions in 27 years, hundreds of billions of liquidity injections, massive asset price inflation, a financial bubble and we’re looking at sub 2% GDP growth:
Weekly GDP Nowcast: http://nyfed.org/GDPnowcast
Q4 2019 → 1.2%
Q1 2020 → 1.7%
Leading indicators yesterday:
While yields keep dropping:
You’re staring at a massive asset price distortion with indices and individual stocks dancing at an 80’s RSI party, while yields and growth not confirming any of this.
I maintain the Fed has set in motion perhaps the most dangerous and reckless asset bubble since the year 2000. Nobody will believe it until something bad happens.
Will Powell be confronted with any of this next week?
Will he get challenged on the obvious effects his not QE lie has on asset prices?
Will he get challenged on the claim that the Fed does not target asset prices when it in effect does?
I doubt it. But I like surprises. And now that repo impact on asset prices has gone mainstream I’d submit it would be irresponsible by the media to not confront Powell on this during next week’s press conference. Not with a one liner questions, but with deep, probing questions and follow up. Don’t let him wiggle out of this. The public deserves to know.


