
Net interest margin, a measure of the difference between the interest income generated by banks or other financial institutions and the amount of interest paid out to their lenders (for example, deposits), has shown an interest pattern from before to after the financial crisis of 2008.
Follow the money. Find the profits!
 Liquidity is money. Regardless of where in the world that money originates, eventually it flows to and through Wall Street. So if you want to know the direction of the next big moves in stocks and bonds, just follow the money. Lee Adler's Liquidity Trader tracks and shows you the monetary forces that drive markets, like the daily real time Federal Withholding taxes shown in this chart. Follow the money. Find the profits! Try it for 90 days, risk free!

Prior to the financial crisis of 2008, NIM was falling for the most part. But after 2008, NIM rose rapidly in 2009 and 2010. From 2010 to 2015, NIM steadily fell. But once 2015 hit. NIM has been steadily rising with The Fed Funds Target Rate.
But for US bank stocks, they have not fared well with The Fed’s balance sheet unwind.
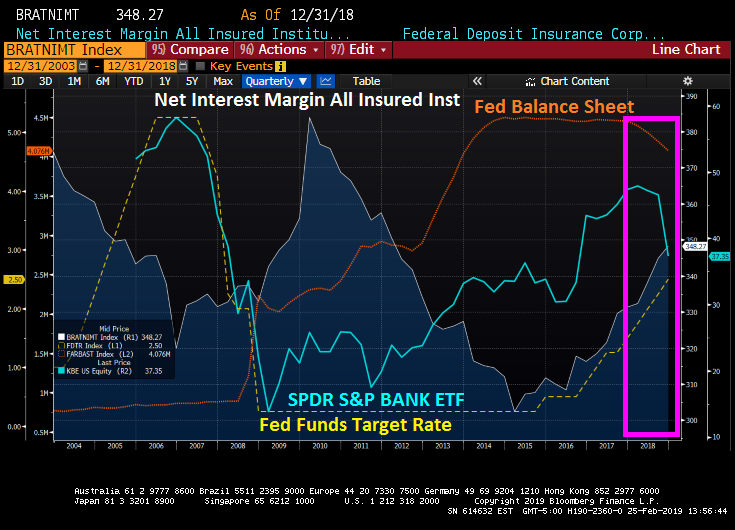
Sad times for bank investors.

Join the conversation and have a little fun at Capitalstool.com. If you are a new visitor to the Stool, please register and join in! To post your observations and charts, and snide, but good-natured, comments, click here to register. Be sure to respond to the confirmation email which is sent instantly. If not in your inbox, check your spam filter.

