

The monthly industrial production indexes contain a wealth of information about the performance of the US economy. They represent the production of factories, mines, and utilities in unit volume, not dollar sales, including totals, and figures by industry. While they do not represent service industries directly, they do so indirectly because industrial production feeds service business and vice versa. The IP indexes give us a pretty good idea of how the US economy is performing overall, and by industry.
There are a number of ways to look at the data. Some are helpful. Some are useless. For example, the Wall Street Journal reported that “Industrial production, a measure of everything made by factories, mines and utilities, rose a seasonally adjusted 0.7% in July, its largest advance since November 2014, the Federal Reserve said Tuesday.” That’s not only useless. It’s misleading. The Journal also claimed that “manufacturing production posted its largest advance in a year, one more sign the sector is stabilizing.” It reached that conclusion based on the seasonally adjusted numbers reported by the Fed.
The problem is that on an unadjusted basis, that is, actual production as opposed to a statistical abstraction, there was no improvement in either the broader index or the manufacturing index.

Click here to view chart if reading in email.
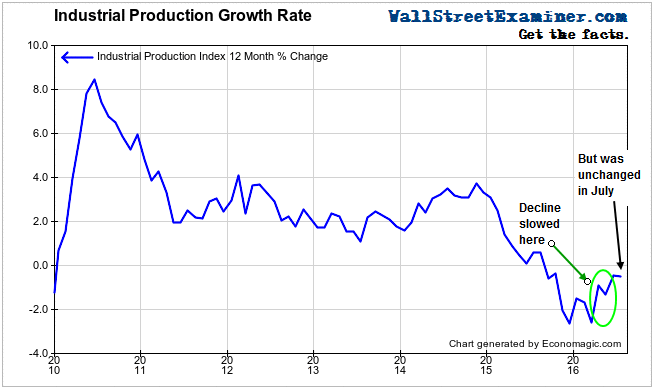
To avoid the problem of seasonal adjustment we merely need to compare the annual rate of change between different periods to see if growth is accelerating or declining. Growth began to slow in December 2014, going negative in September 2015. The year to year decline reached -2.6% in both December 2015 and March of this year. It was at that point that the downward momentum stopped, with the year to year decline improving to -0.45% in June. But in July, the annual rate of change slipped to -0.5%. Contrary to what the Fed reported and the media regurgitated, there was no improvement in July.
Looking at the long term trend, here’s another interesting tidbit. The level of the index in July was only +0.6% higher than in July of 2007 when IP was peaking after the housing bubble had begun to deflate. At the same time, the S&P 500 is 54.4% higher. And they say this isn’t a bubble!

Click here to view chart if reading in email.
Let that sink in for a moment. stocks have risen 54% while industrial production is virtually unchanged since 2007. Therein lies the power, and the uselessness of central bank market rigging. It works for the speculators. It doesn’t work for the economy. A case can be made that by discouraging savings, QE and ZIRP actually retard economic growth.
Notably, as IP has stalled over the past year, stock prices have continued to rise. Even though the Fed ended its QE program, it has kept interest rates near zero. At the same time the 2 headed monster of the BoJ and ECB have continued and even increased their QE programs. In this interconnected world of finance dominated by multinational megabank trading firms, QE anywhere is QE everywhere. So US stocks continue to inflate while the US economy languishes.
Prior to last year, skyrocketing oil and gas production contributed mightily to total IP. Had it not been for the energy boom, industrial production overall would be far weaker today than in 2007. Breaking out Energy production and IP Ex Energy better illustrates just how weak US production is. Without the benefit of a 21.4% increase in Energy production since 2007, Industrial Production would be down 5.6% since then. Making matters worse, energy production declined over the past year.

Click here to view chart if reading in email.
The Wall Street Journal’s interpretation of the Manufacturing Production data was that it had posted its best gain in a year. That’s just false. Over the past year the annual growth rate has fluctuated around zero. The best gain was +0.88% in July 2015, with October 2015 coming in second at +0.87%. The year to year gain this July was +0.03%, or virtually unchanged. That was worse than June’s gain of +0.39% y/y. There’s no way to construe that as the “best gain in a year” unless you make up phony numbers using seasonal adjustments.

Click here to view chart if reading in email.
The US manufacturing “recovery” is dead. It recovered most strongly between 2009 and 2010 and the gains have slowed ever since. The growth rate has fluctuated around zero for the past year. Manufacturing production is still 5.2% below its level of 9 years ago. That production, and the jobs that go with it, are likely to be permanently lost. Policies that discourage savings and real investment coupled with trade policy that favor moving manufacturing jobs to emerging markets where worker wages are a pittance and working conditions are worse, are largely to blame.
Bottom line, don’t believe everything you read about the economy in the Wall Street Journal or any of the mainstream financial media. It may not be the whole story. In fact, it may even be dead wrong. For Industrial Production, the seasonally adjusted gain of 0.7% is just a made up number, as all seasonally adjusted data is. It’s not only meaningless in this case, it’s misleading. Industrial production did not strengthen in July.
Follow the money trail into the markets in the Wall Street Examiner Liquidity Trader Pro Reports.
Join the conversation and have a little fun at Capitalstool.com. If you are a new visitor to the Stool, please register and join in! To post your observations and charts, and snide, but good-natured, comments, click here to register. Be sure to respond to the confirmation email which is sent instantly. If not in your inbox, check your spam filter.

