

First time claims for unemployment compensation continued their string of record lows for the same week of the year. The actual number, not subject to any seasonal hocus pocus was 220,000 (rounded).
That was just 1,548 claims per million employed workers last week. That compares with 1,817 per million in the same week of 2007 just as the housing bubble was beginning to implode and 1,914 in that week of 1999 as the Internet Bubble was driving toward its orgiastic climax. In stock market terms we think of moves like this as “blowoffs.” They are the final heartbeats of a bubble before its last heartbeat and rigor mortis setting in.
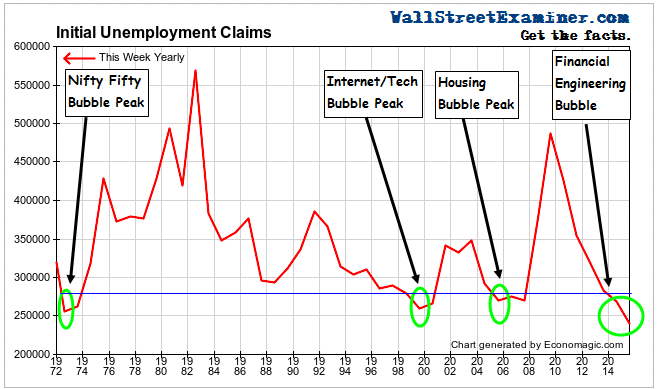
Previous record low strings in initial claims were always associated with bubble peaks and peak economic activity resulting from those bubbles. Many bullish pundits have claimed that the behavior of the markets over the past several years was not a bubble because public participation was limited. However, historically not all bubbles have involved Joe and Jane Sixpack. Some bubbles have been limited to institutional manias. The Nifty Fifty bubble of the late 1960s and early 1970s is more analogous to today, than the more recent example of the housing bubble.
The stock market has recently had a break. Historically, employers usually seem to be the last to get the news when bubbles start to deflate. They move in herds too. The very fact of employers’ record long term ebullience should be warning enough, as chronicled here in these reports over the past year. Employers still haven’t wisened up. They are still in an employee hoarding bubble that has yet to burst. The real job cuts are still to come.
The Department of Labor (DoL) reports the unmanipulated numbers that state unemployment offices actually count and report each week. This week it said, “The advance number of actual initial claims under state programs, unadjusted, totaled 219,591 in the week ending September 19, an increase of 20,625 (or 10.4 percent) from the previous week. The seasonal factors had expected an increase of 18,232 (or 9.2 percent) from the previous week. There were 239,780 initial claims in the comparable week in 2014.”
Below is a 10 year chart of the actual data.In the comparison of the current week with the comparable week in past years, the record low is apparent. .

Click here to view chart if viewing in email
We use actual data, as opposed to the seasonally finagled headline numbers which Big Media shovels out for mass consumption. We want to see from the actual numbers if there’s any evidence of trend change. So we look at how the current week compares with this week in prior years and whether there’s any sign of change in the trend. The actual change for the current week versus the prior week was an increase of 20,600 (rounded). .
The 10 year average for actual data for that week was an increase of 15,500. This year was worse than that average and much worse than 2014 which had a decline of -2,500.
One week of weakness does not make a trend. Week to week changes are noisy. What matters is the trend. Since 2010 the annual change rate each week has mostly fluctuated between -5% and -15%. Last week was near the middle of that range with a year to year drop of -8.4%.
A shift to a year to year increase in claims would be a sign that the US economy could be headed for recession. The stock market is a key. When it weakens, employers will take their cues from that. The Fed knows that businesspeople watch the stock market and often base hiring and firing decisions on its direction. A weakening market would not only make the Fed even more cautious about attempting the charade of raising rates, it would at some point even put QE back on the table.
But in the meantime, businesses have acted out a job hoarding bubble in response to the signaling they’ve gotten from the Fed QE driven stock market bubble that has only recently begun to deflate.

Click here to view chart if viewing in email
The real time Federal withholding tax data which I track was consistent with the claims data until mid August. That data was very strong in July and through mid August but began to tumble late in the month. That continued through September 16 before a bit of a bounceback over the past week. The year to year growth rate, adjusted for wage inflation, had dropped to just 1% last week before bouncing back to just over 2% this week.
The numbers were particularly weak during the nonfarm payrolls survey week, which is the week that includes the 12th calendar day of the month. That suggests that the Wall Street economist herd estimate for the jobs numbers for September will be too high.
The recent weakening in withholding may be part of a normal short term cycle or it could be something more serious. We chart and analyze this data in the weekly Wall Street Examiner Pro Trader- Federal Revenues report. It has been an excellent predictor of where the final revised GDP estimate for each quarter would be. It currently shows a CPI adjusted growth rate of approximately 1.5% for the third quarter, suggesting that the final print for GDP will gravitate toward the +1-2% range. Given the vagaries of the seasonal adjustment process, the sampling error in the limited initial data, and the multiplier effect of annualizing the quarterly errors, the first number could be well above or below that. The third estimate usually hones in on what actually happened during the quarter. By following the withholding tax growth rate, we should have a good handle on the reality of the US economy’s actual growth overall rate.
Of course, even that is misleading. In the Tale of Two Economies, massive gains accruing to the investor/speculator class skews the headline economic numbers positive while the bulk of the American people experience no gains whatsoever. QE and ZIRP have caused Ben Bernanke’s trickle to pool at the top with the banker/speculator/investor/corporate looter class. That pooling has made the system top heavy and unstable. As the pool begins to leak and then collapse, the entire system will cease to function in the flood.
The record lows in initial claims represent an historic economic bubble. It is a bubble that was born out of and is joined at the hip with the financial engineering bubble that has been metastasizing in the US economy for a generation. We can thank central bank policy for the economic divide it has wrought and for the cataclysm that may lie ahead as a result.
If you are new to these reports, here is a review of the key historical antecedents of the extreme readings on initial claims from a post, August 13, 2015.
Historical Initial Claims and Bubbles
Click here to view chart if viewing in email
“In recent weeks, Big Media and others have noted the fact that claims were recently lower than the record low of 1973. What they failed to mention was that that low came well after the Dow reached an all time high in January of that year. The devastating 1973-74 bear market, which cut the value of stocks by 50%, was in its early stages. This was an early example of employers being late to the funeral.
“Similar employer hoarding of workers has been associated with bubbles in the more recent past and has led to massive retrenchment, usually within 18 months or so. In the housing bubble, employer hoarding behavior continued well beyond the peak of that bubble in 2005-06.
“It’s worth noting that there was an institutional stock market bubble in 1972-73. It was the Nifty Fifty bubble, where the biggest best known stocks kept soaring while everything else in the market went nowhere. A bubble does not require mass public participation. Institutional bubbles are just as insidious, even more so.
“The current string of record lows in claims is now 6 months beyond the point at which other major bubbles have begun to deflate. Based on the fact that previous records were attained at and for some time after the peaks of massive bubbles, by that standard, the current financial engineering, central bank bubble finance bubble, which is very much a big money, institutional bubble, may be the bubble to end all bubbles!

Join the conversation and have a little fun at Capitalstool.com. If you are a new visitor to the Stool, please register and join in! To post your observations and charts, and snide, but good-natured, comments, click here to register. Be sure to respond to the confirmation email which is sent instantly. If not in your inbox, check your spam filter.

