
Jesse’s Cafe Américain has its usual collection of great charts and great analysis, particularly on precious metals like Gold and Silver. Including this gold chart.
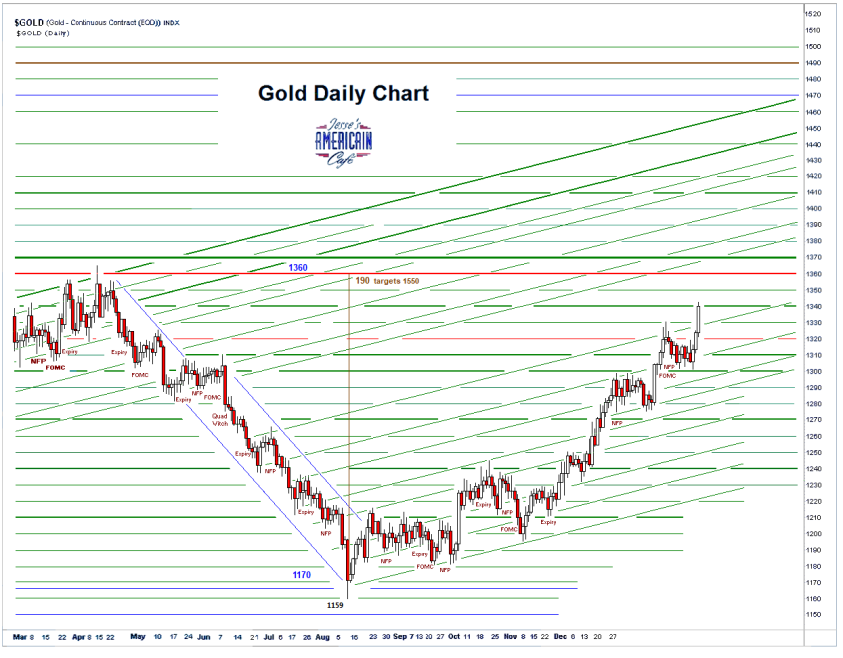
Yes, gold prices have that meteor crater pattern with a swing to the upside.
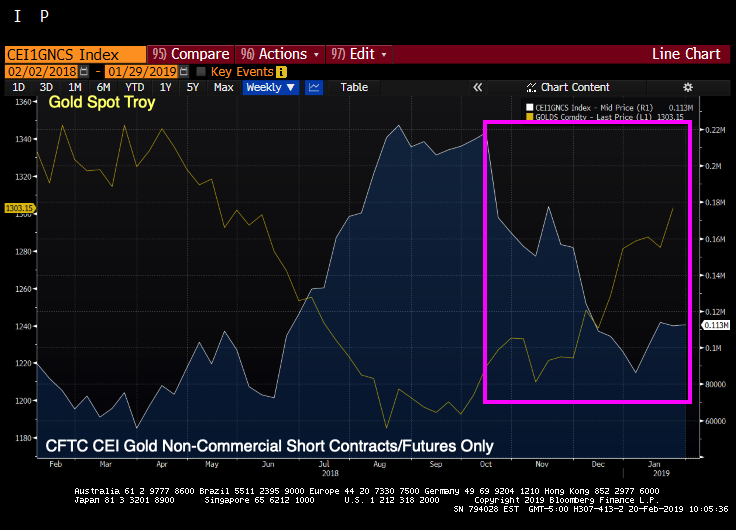
As we would expect, gold shorts are decreasing as gold prices rise again.
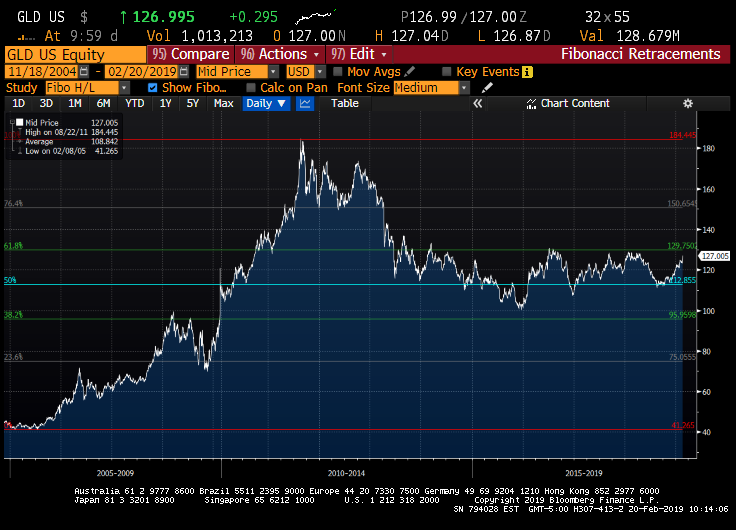
But in terms of resistance, a simple Fibonacci Retracement shows that Gold (SPDR Gold ETF) has been trading in a fairly tight resistance range in recent years.
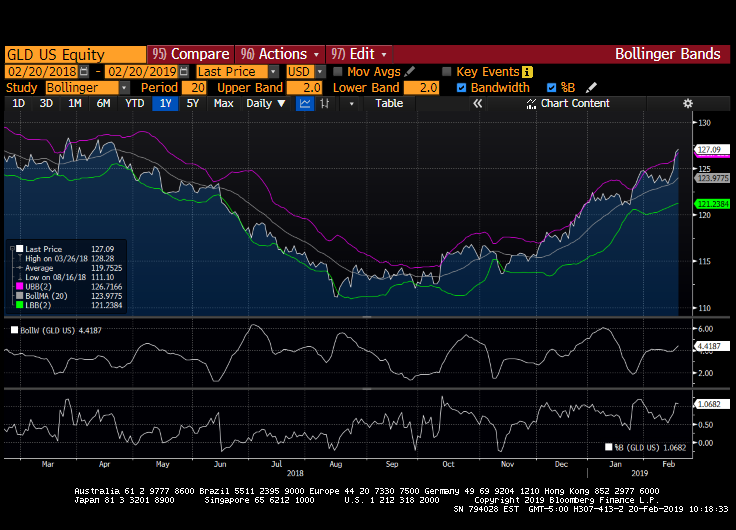
But in terms of Bollinger Bands, gold (SPDR Gold ETF) has broken through the upper band (UBB(2)).
If we look at the SPDR Gold ETF pattern using Ichimoku, we see that the current gold ETF price is below the leads.
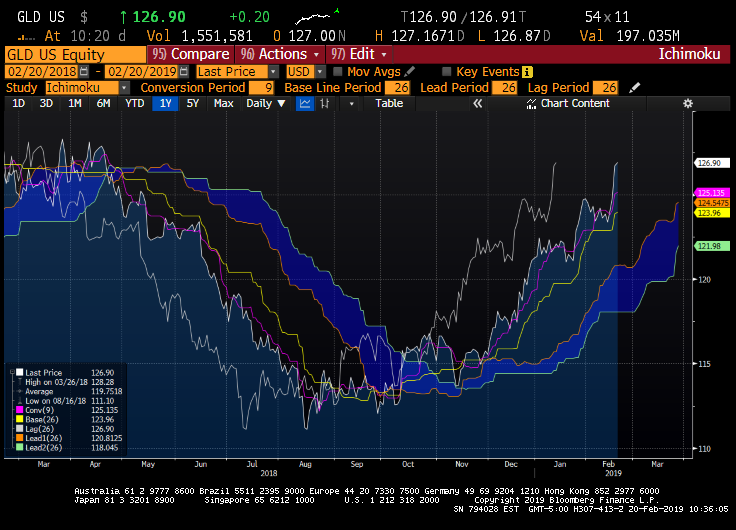
Break out or hitting resistance? My bet is on resistance after a short-term breakout.
Maybe its time for “The Gold Tooth Blues.”
Join the conversation and have a little fun at Capitalstool.com. If you are a new visitor to the Stool, please register and join in! To post your observations and charts, and snide, but good-natured, comments, click here to register. Be sure to respond to the confirmation email which is sent instantly. If not in your inbox, check your spam filter.

